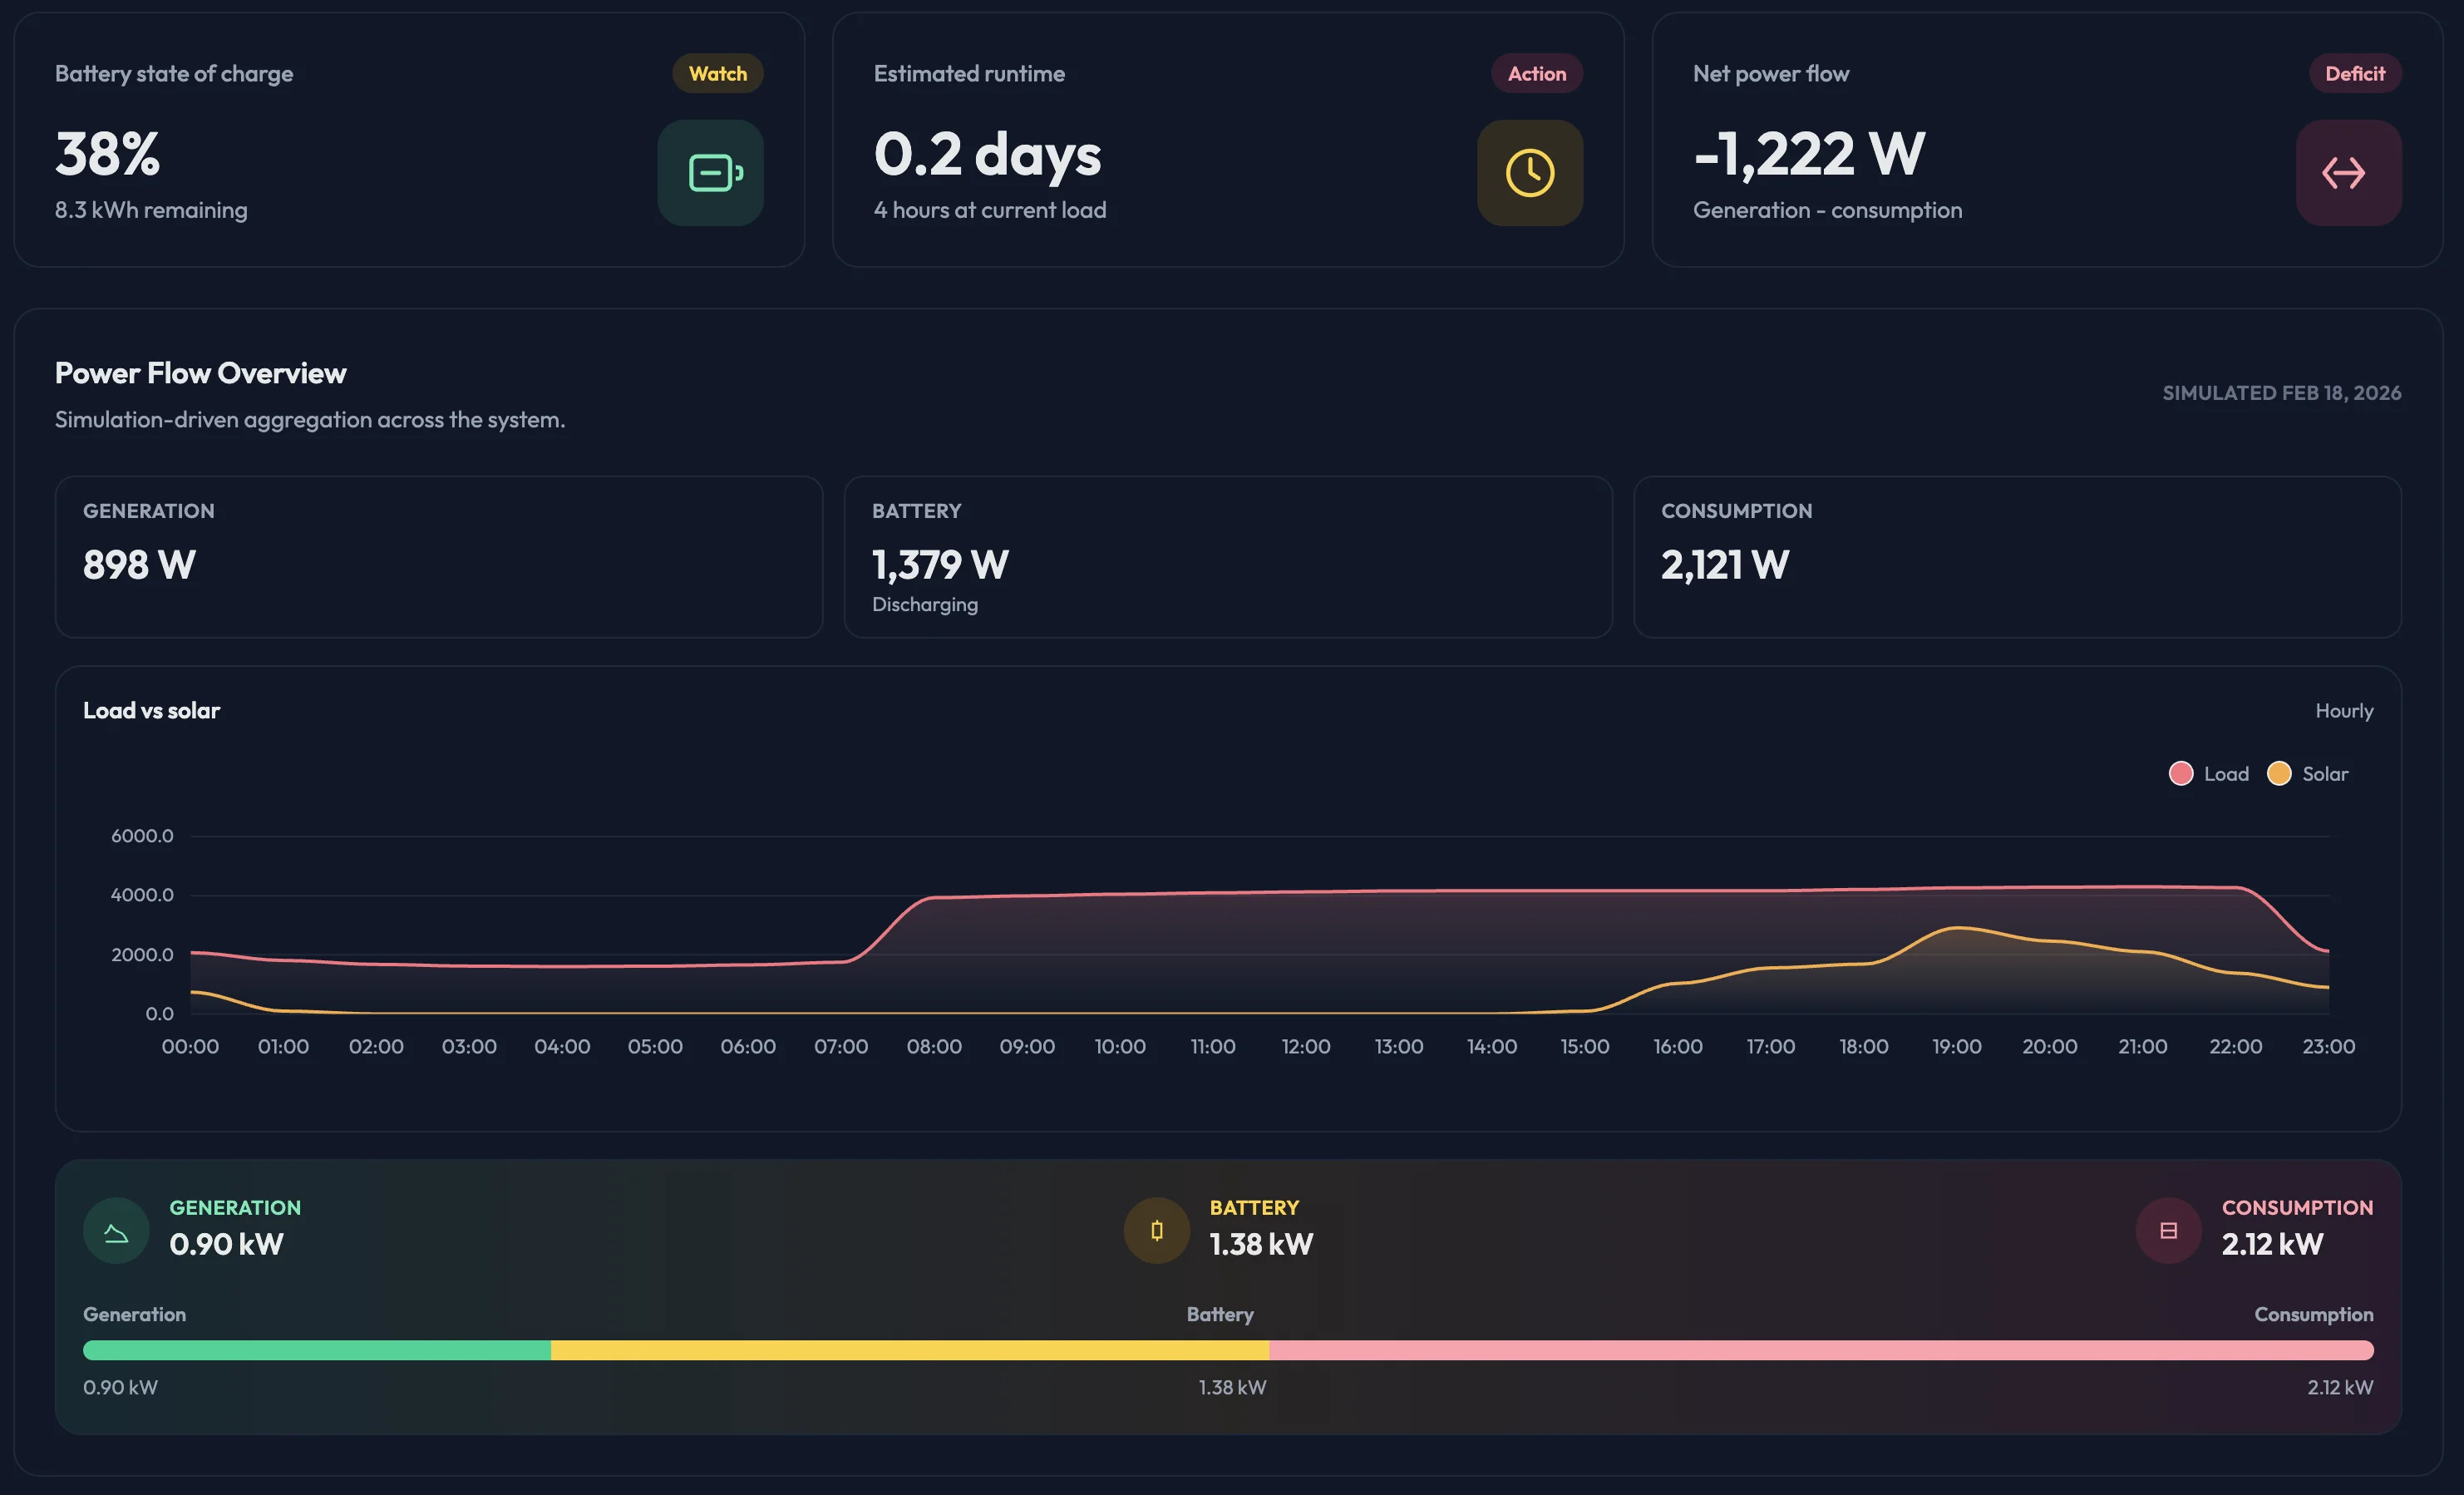
Live energy flow graph
See where power comes from and where it goes.
Follow each flow step from source to load without guessing.
PyMox visualizes live energy flows and gives you strategy controls for smarter energy decisions.
Move from reactive troubleshooting to proactive control with one clear product surface for monitoring, planning, and optimization.
PyMox is a dashboard, monitoring, and control layer for battery-centered energy systems.
It covers battery, solar, grid, and mixed DC/AC setups with clear visibility and automation-ready controls.
Instead of splitting insight across disconnected tools, PyMox keeps operations and strategy in one place so decisions stay consistent.
Built for operators who need visibility and control without guesswork.
See where power comes from and where it goes.
Follow each flow step from source to load without guessing.
Track SOC, charging behavior, and capacity trends.
Spot battery stress early and protect long-term runtime.
Monitor grid pull, export moments, and limits.
Make informed decisions around tariffs, caps, and events.
Combine charging sources with clear priority control.
Coordinate sources in one model instead of manual switching.
Switch between peak shaving, island mode, and more.
Choose the behavior that matches your location and constraints.
Get warnings for low SOC, overload, and charger issues.
Turn threshold breaches into actions before uptime is affected.
Review day, week, and month energy performance.
Compare trends and evaluate strategy changes over time.
Connect APIs, webhooks, and external integrations.
Use your own automations while keeping PyMox as the control center.
PyMox applies a clear priority model so system behavior stays predictable.
A quick product tour of the core views users rely on every day.
Each view turns raw telemetry into actionable insight so you can protect reserve, reduce grid costs, and improve system reliability.
The screenshots below are paired with practical interpretation so operators can move from viewing data to making concrete control decisions.
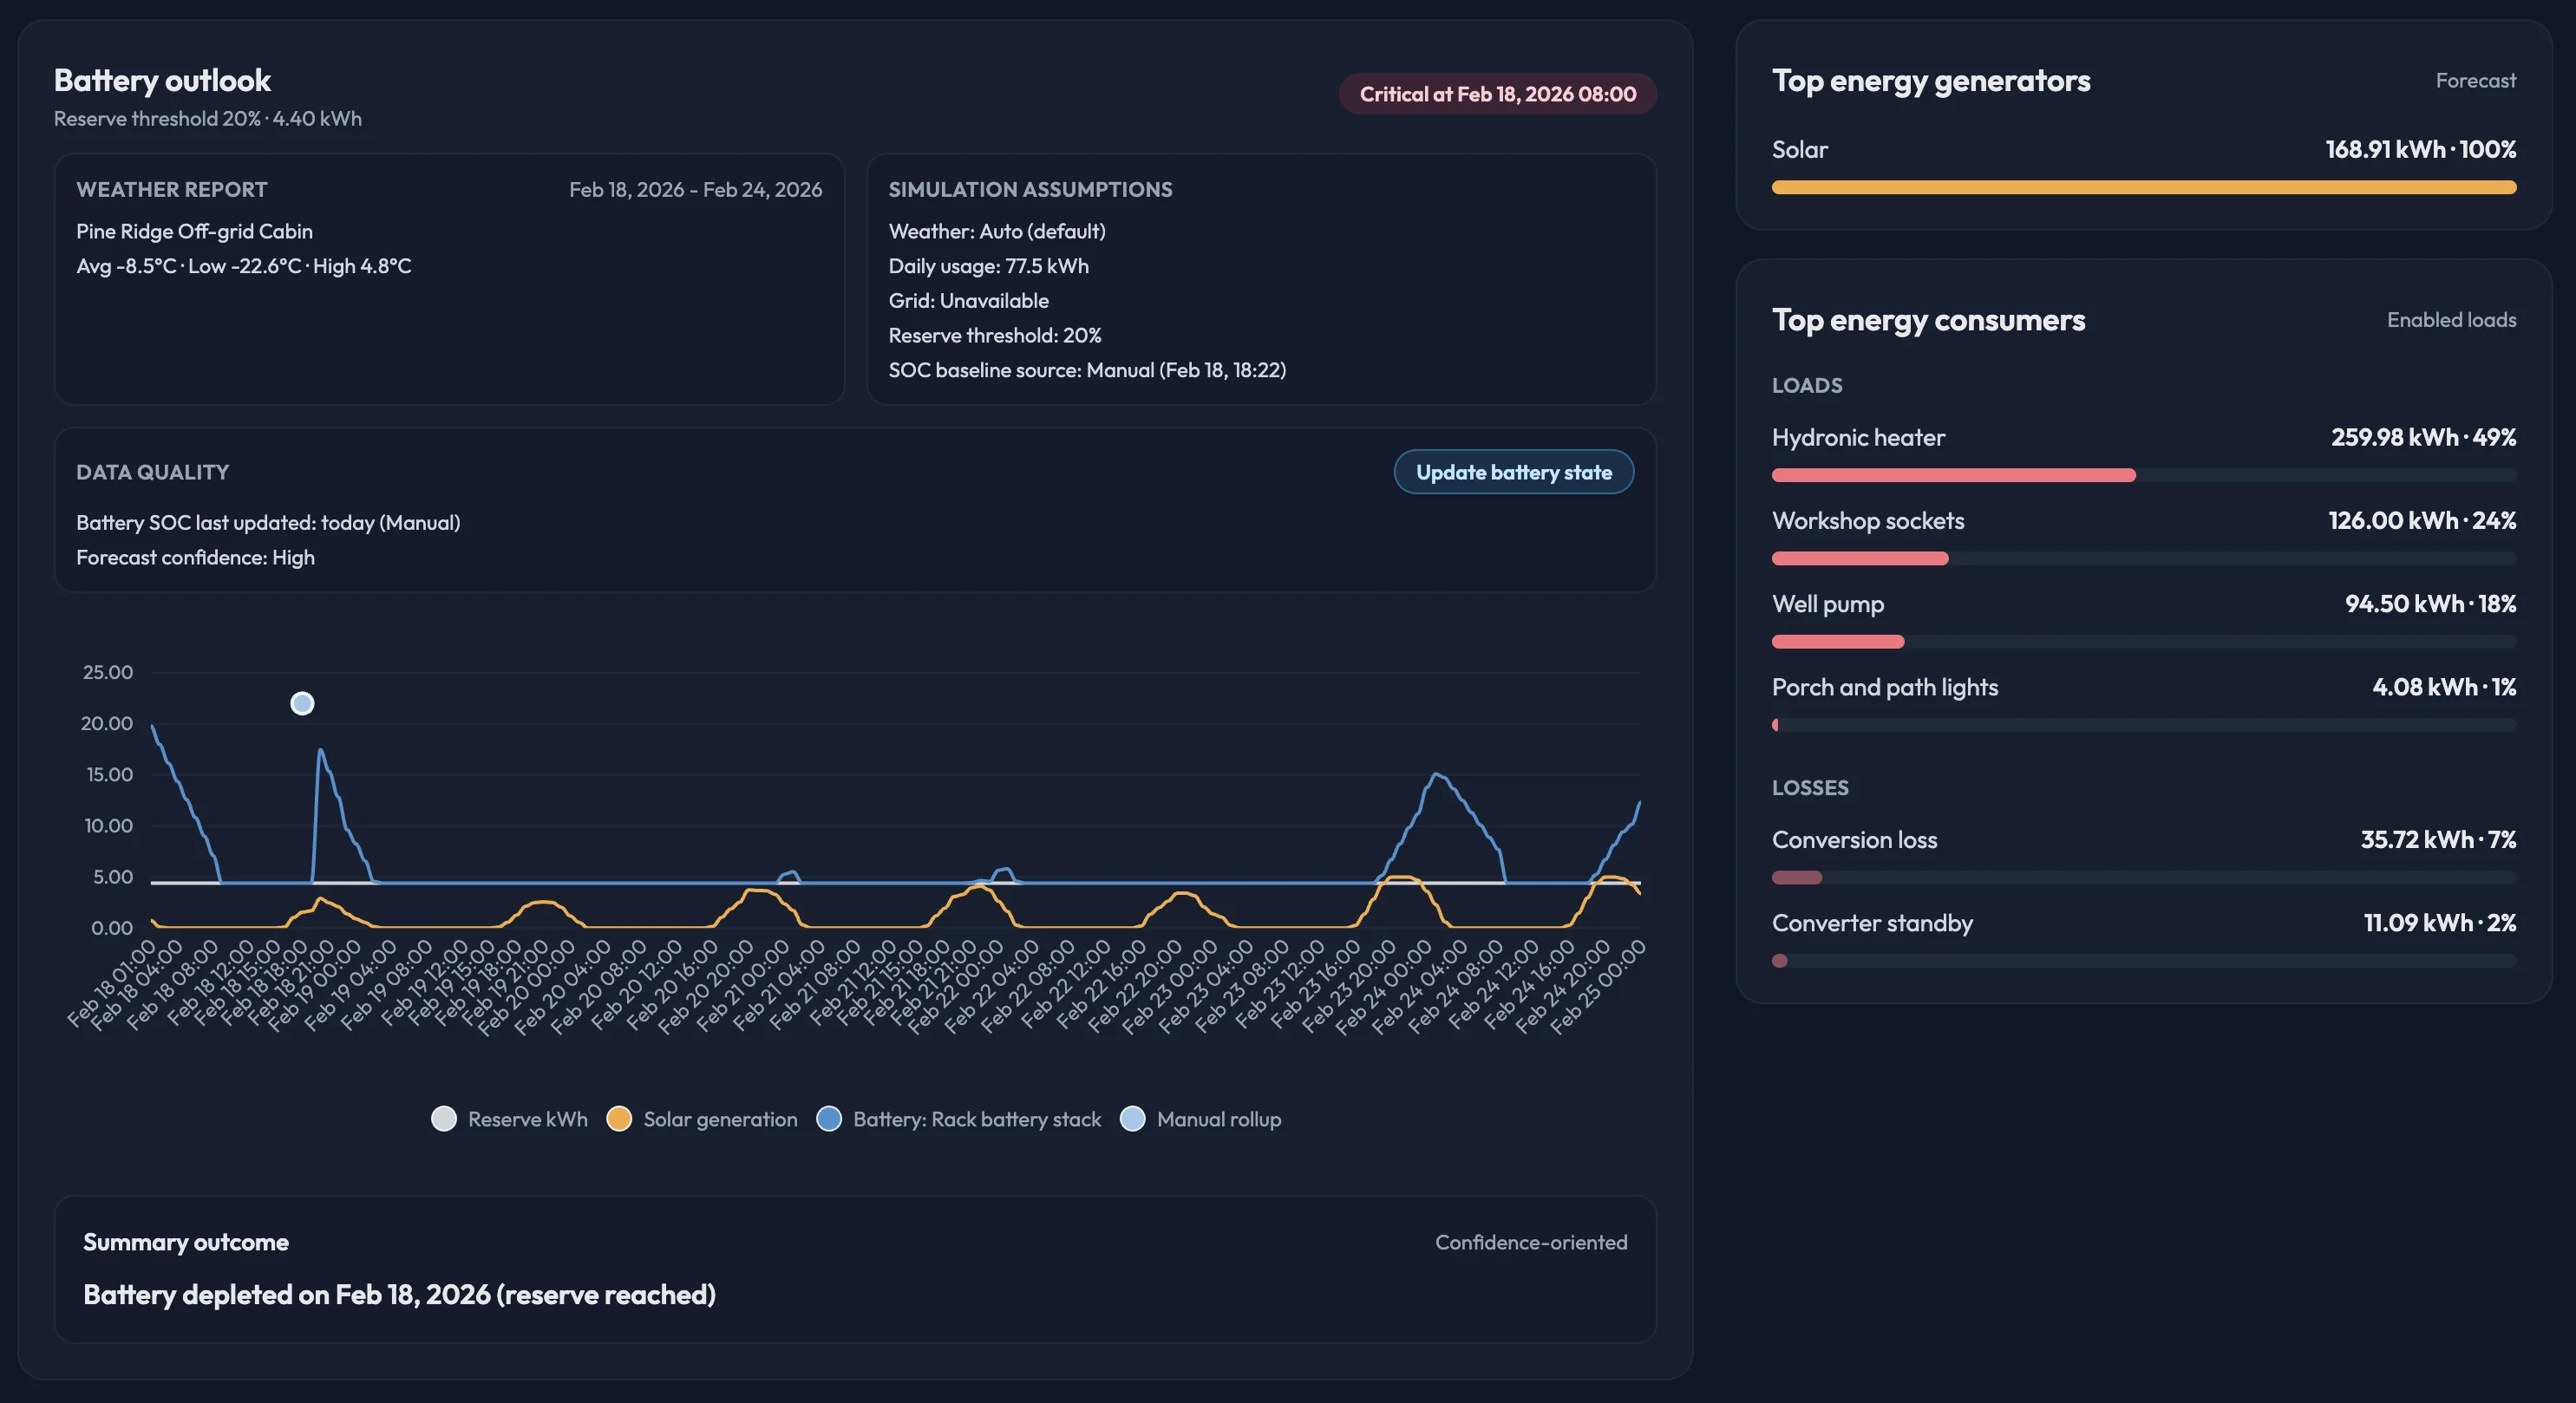
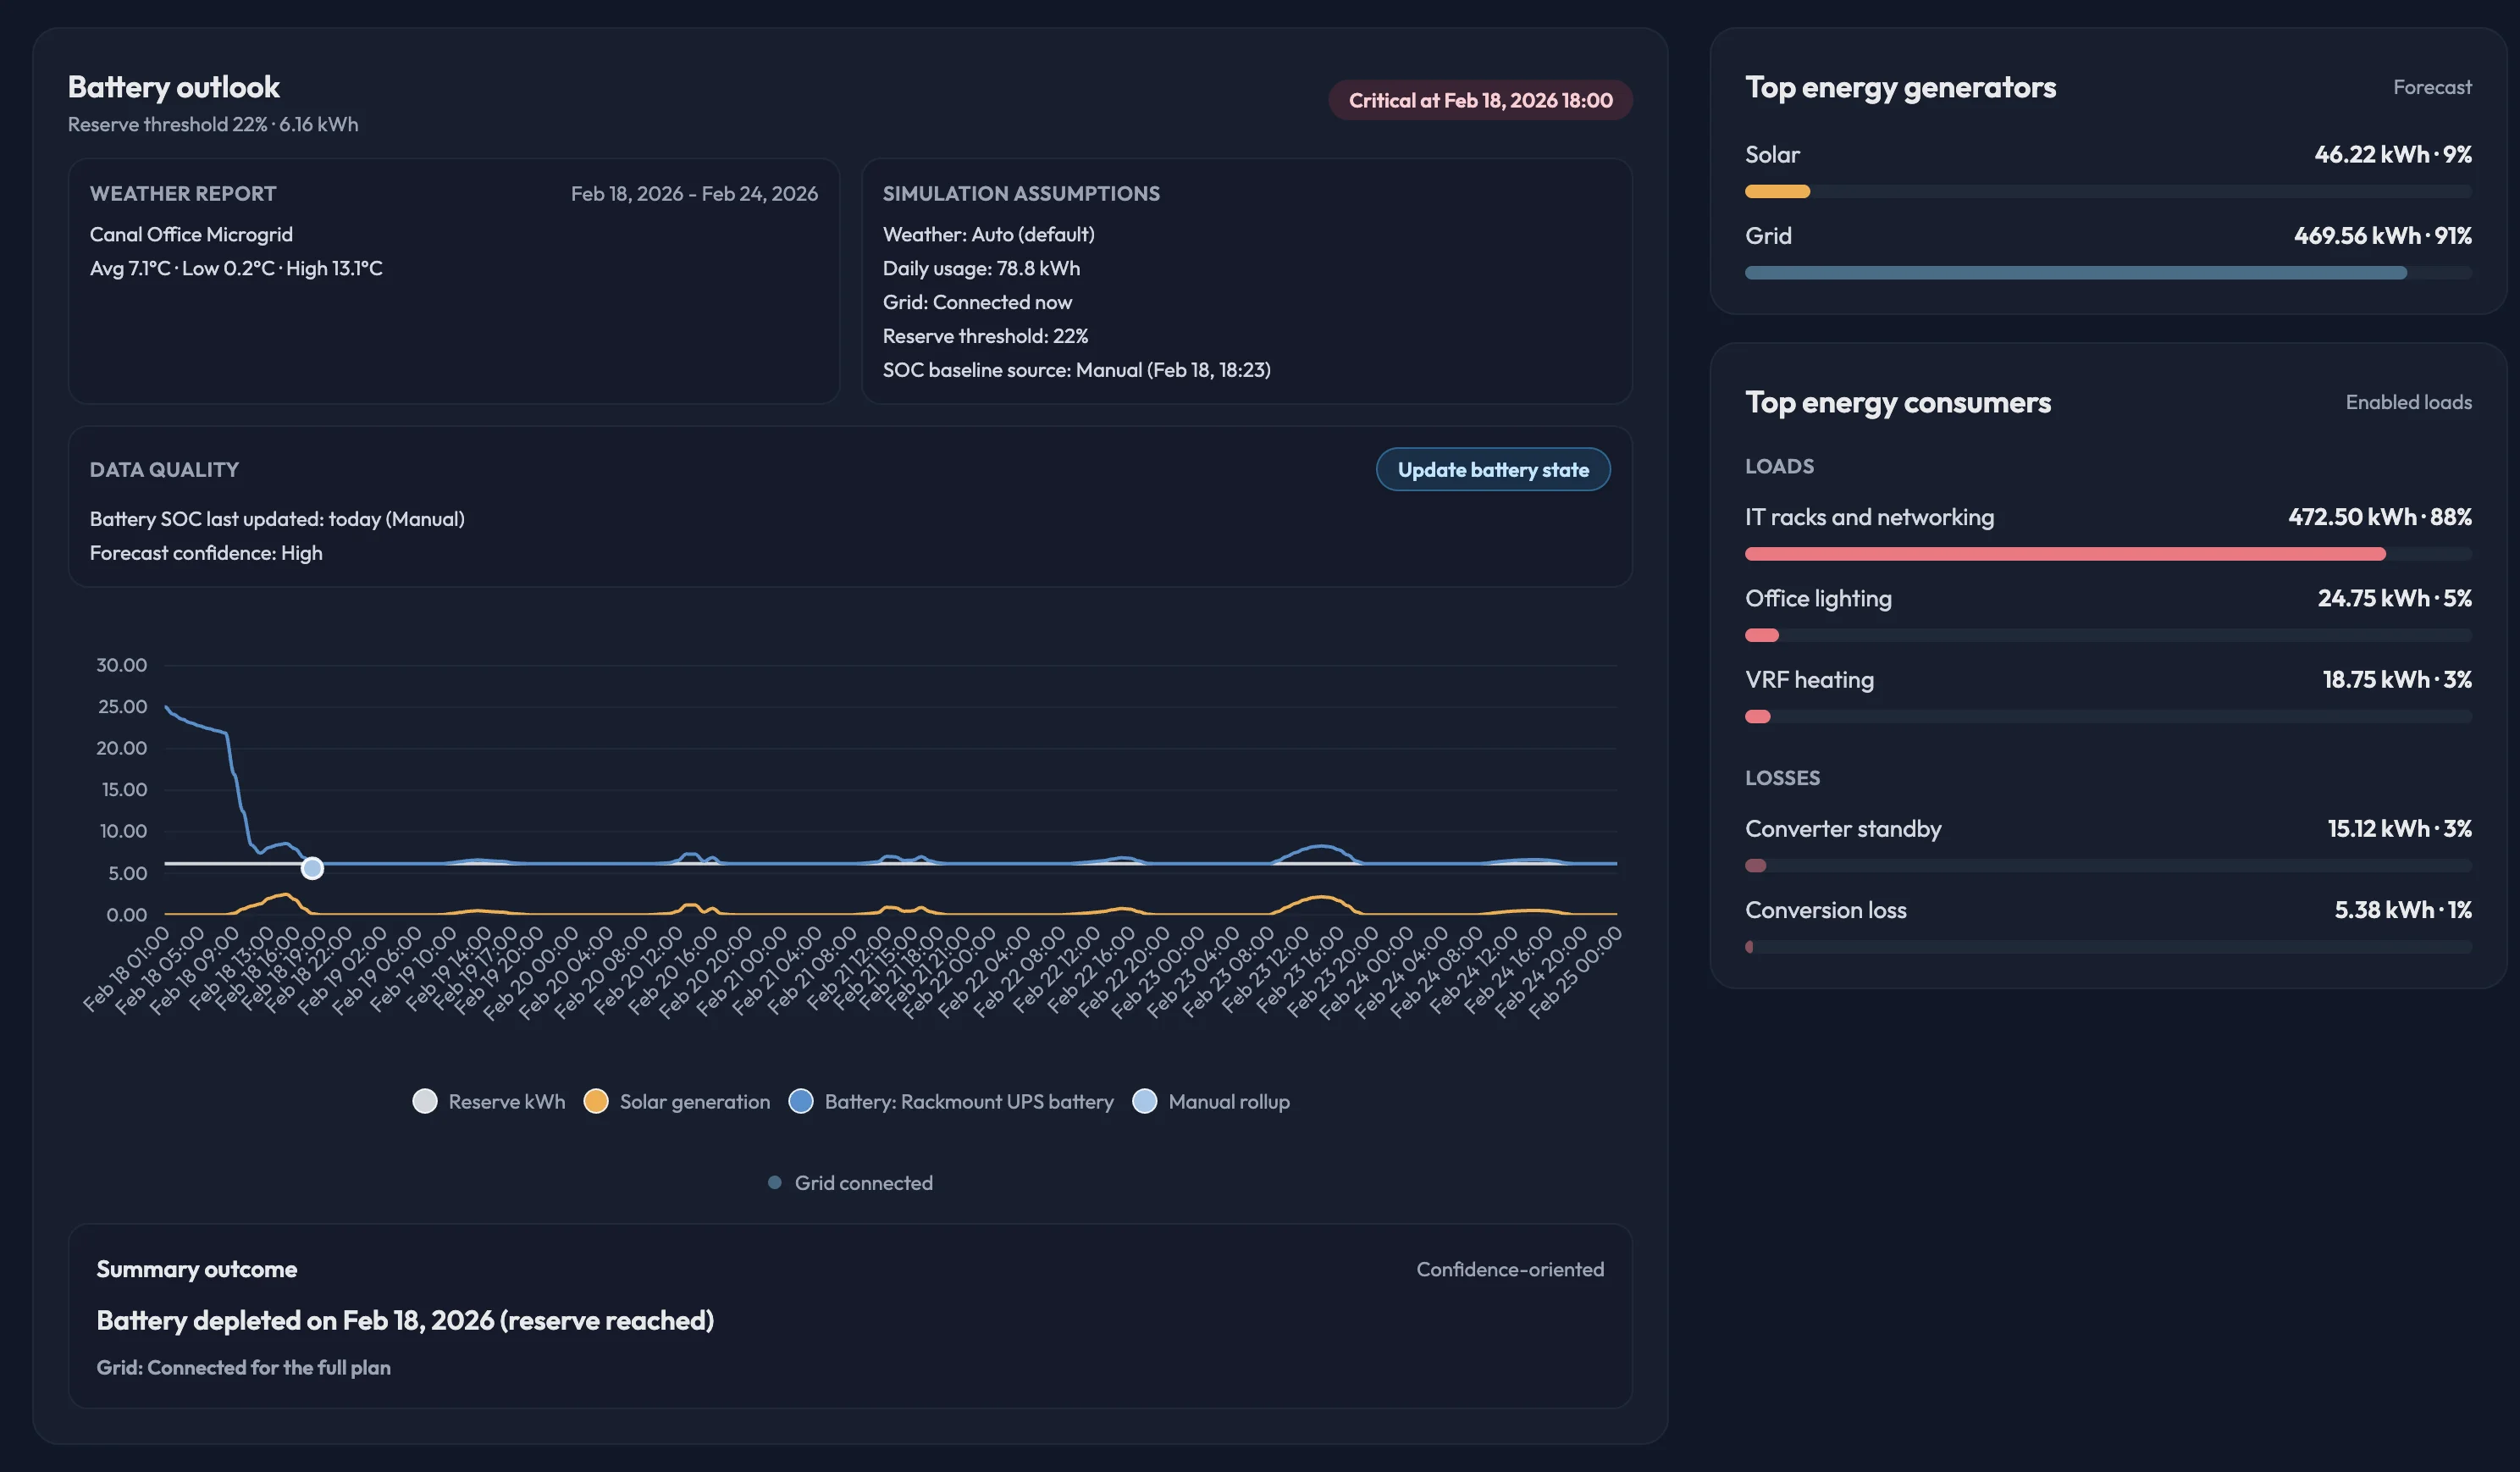
This view explains if your current reserve strategy can survive the forecast window and which loads are most responsible for battery depletion.
For grid-connected systems, this panel clarifies how much performance depends on the grid versus local generation and storage behavior.
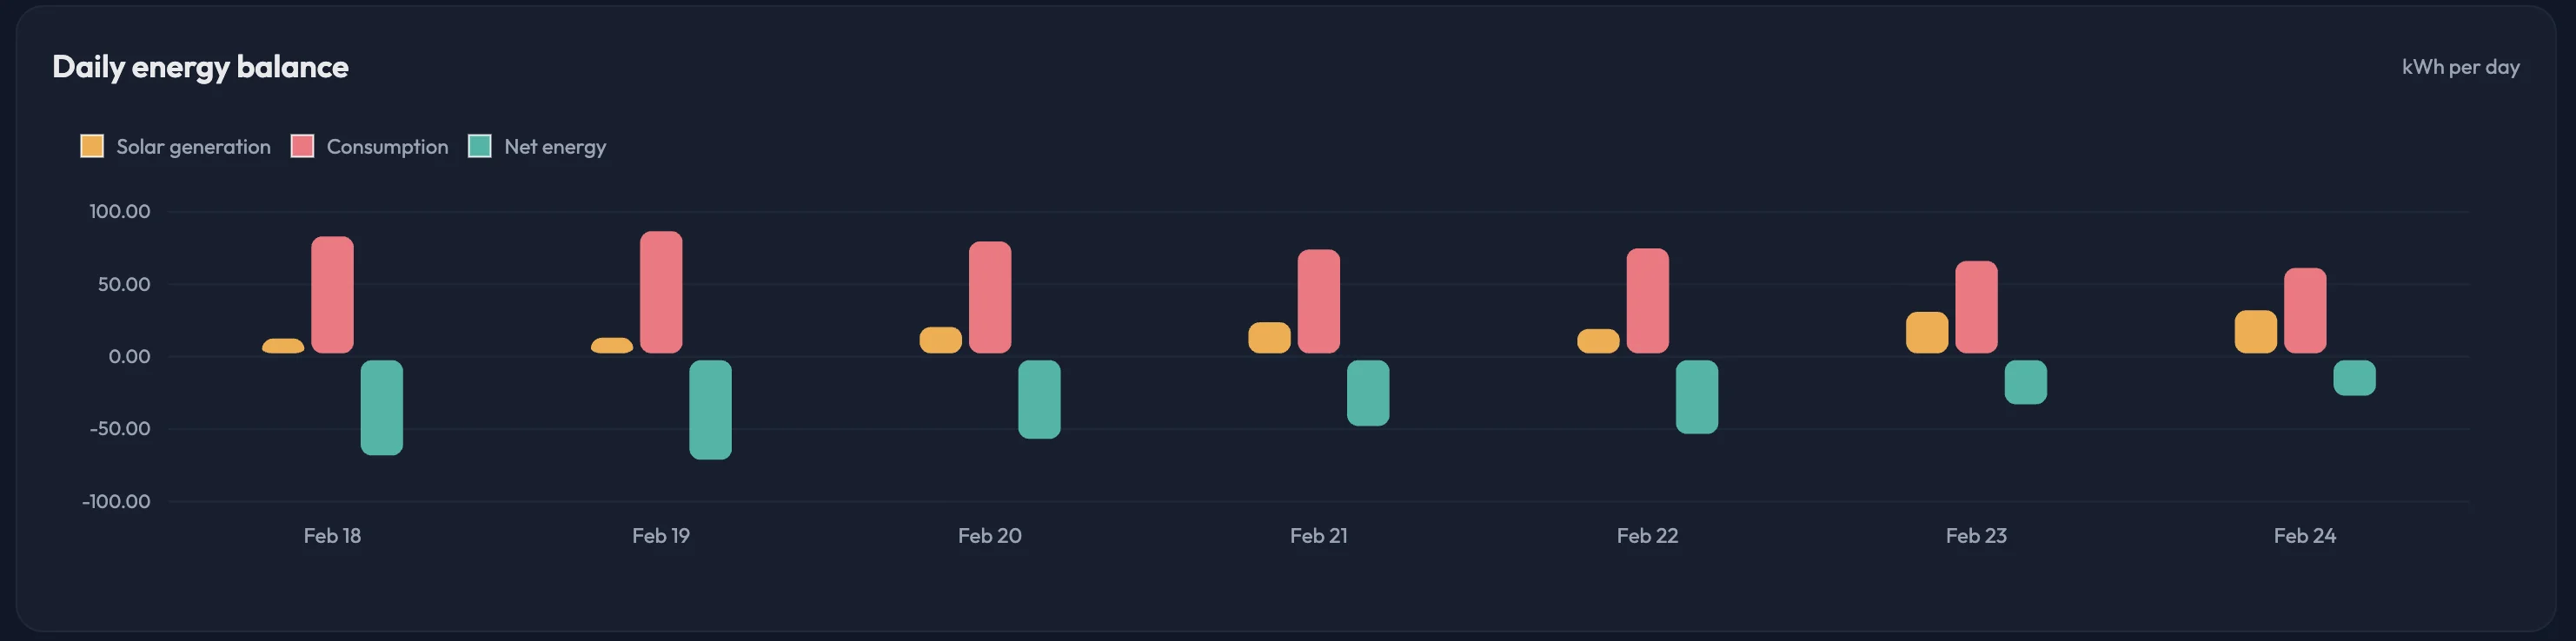
This chart gives a clean day-by-day balance between production and demand, making trend changes visible before they become operational issues.
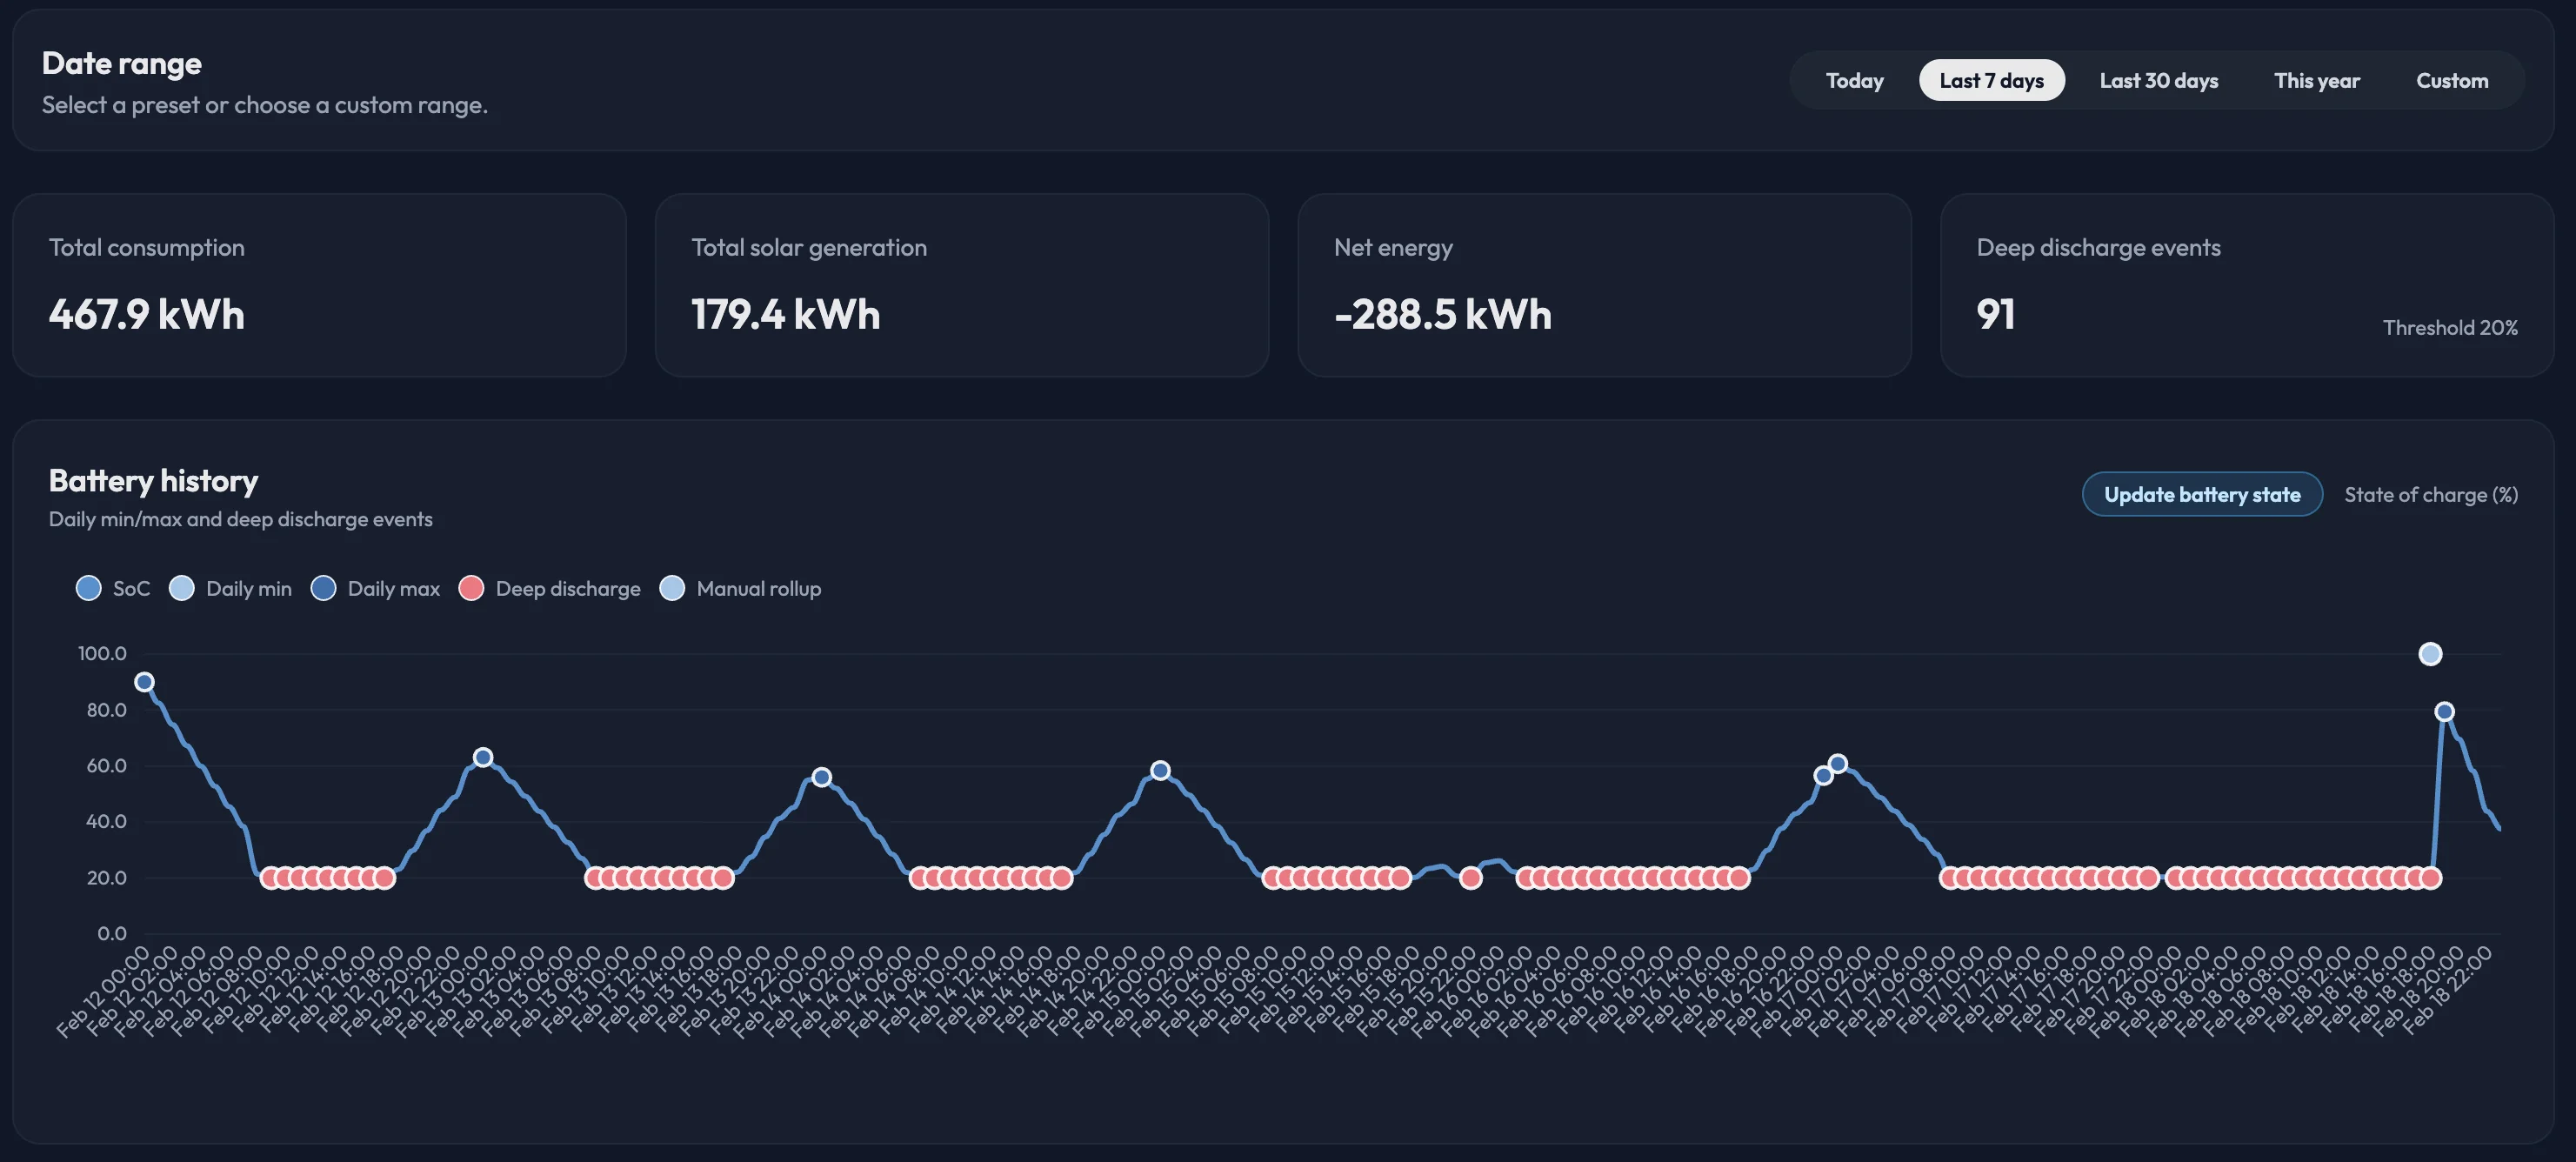
Battery history exposes how hard the system cycles in practice, so you can protect battery health while keeping enough usable capacity.
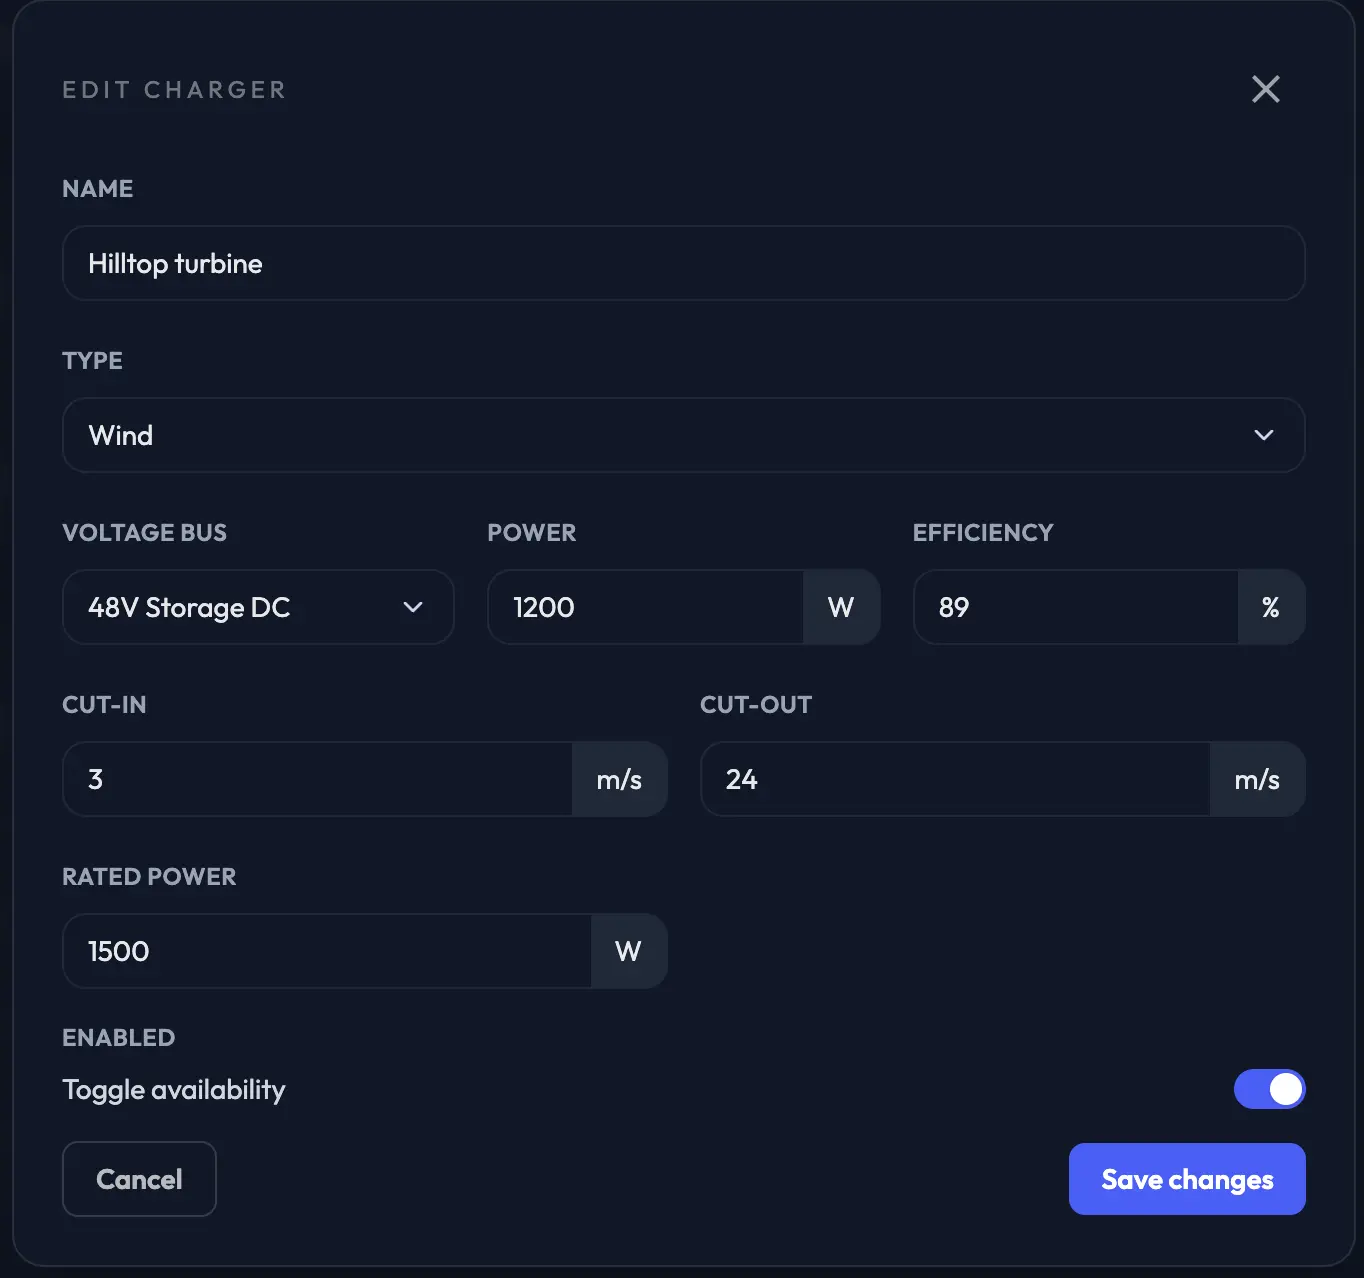
Designed to integrate with common inverter and charger setups.
Explore detailed scenarios on the use-cases page.
PyMox is developed in the open with a transparent roadmap and regular updates.
Start with a clear baseline, apply strategy, and keep improving performance as your system evolves.