Each scenario below focuses on practical operational clarity and strategy validation.
RV and camper systems
RV systems often combine campsite power, solar, alternator charging, and battery storage. PyMox helps you model that mix clearly before making strategy changes. You can validate reserve behavior for overnight use and understand where flow priority causes constraints.
Typical challenges
- Unexpected breaker trips at 6A, 10A, or 16A campsite limits
- Not knowing real charge priority behavior when multiple sources are active
- Guessing remaining battery life before overnight loads
How PyMox helps
- Visualizes live energy flow between battery, solar, alternator, and grid
- Models charge-when-connected logic under campsite limits
- Simulates discharge priority and reserve behavior
Outcomes
- Stay within campsite limits
- Understand overnight usage
- Avoid battery depletion
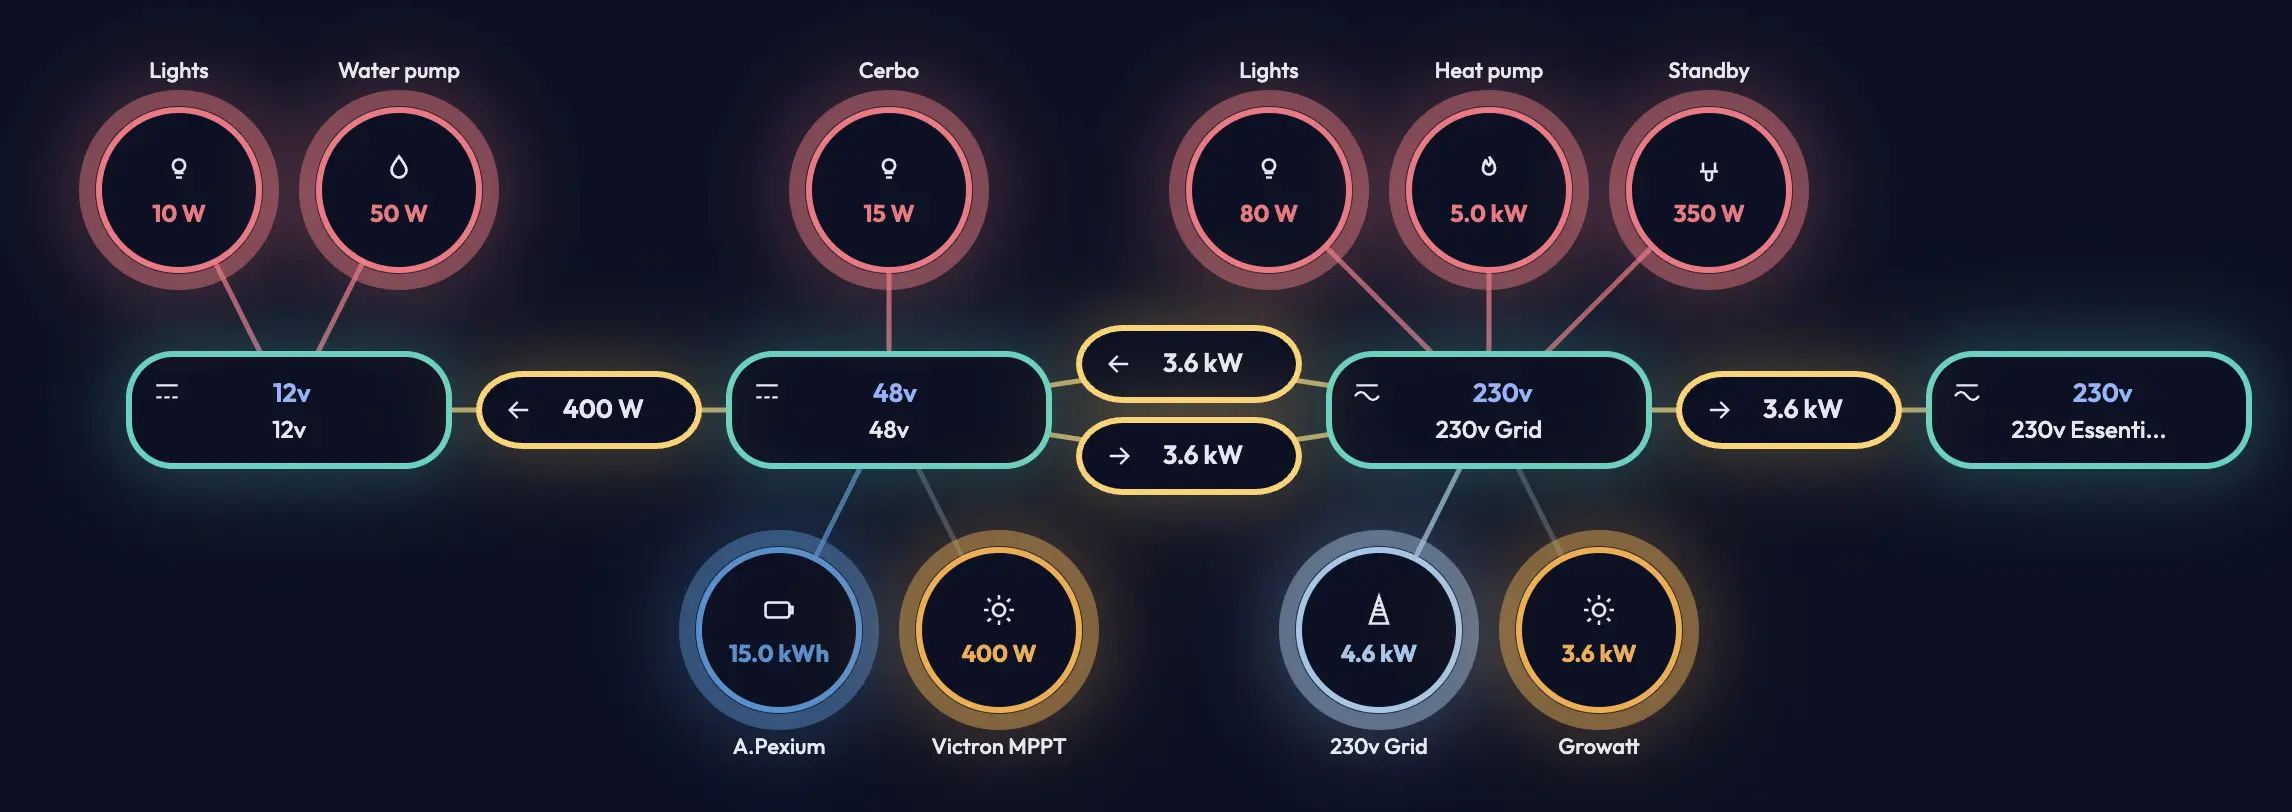
Example: Validate an evening scenario where shore input is limited to 10A while heating and cooking loads are active.
Off-grid homes
Off-grid households need predictable behavior through seasonal variation. PyMox supports scenario modeling for low-production periods and helps you validate when backup generation should be scheduled. It gives a technical view that remains understandable for day-to-day planning.
Typical challenges
- Winter underproduction and low solar windows
- Unclear load distribution across priority circuits
- Reactive decisions instead of planned strategy
How PyMox helps
- Models seasonal scenarios and low-generation periods
- Tracks historical kWh usage trends
- Validates battery reserve thresholds against load patterns
Outcomes
- Predict low-production risk
- Improve generator scheduling
- Plan for better battery longevity
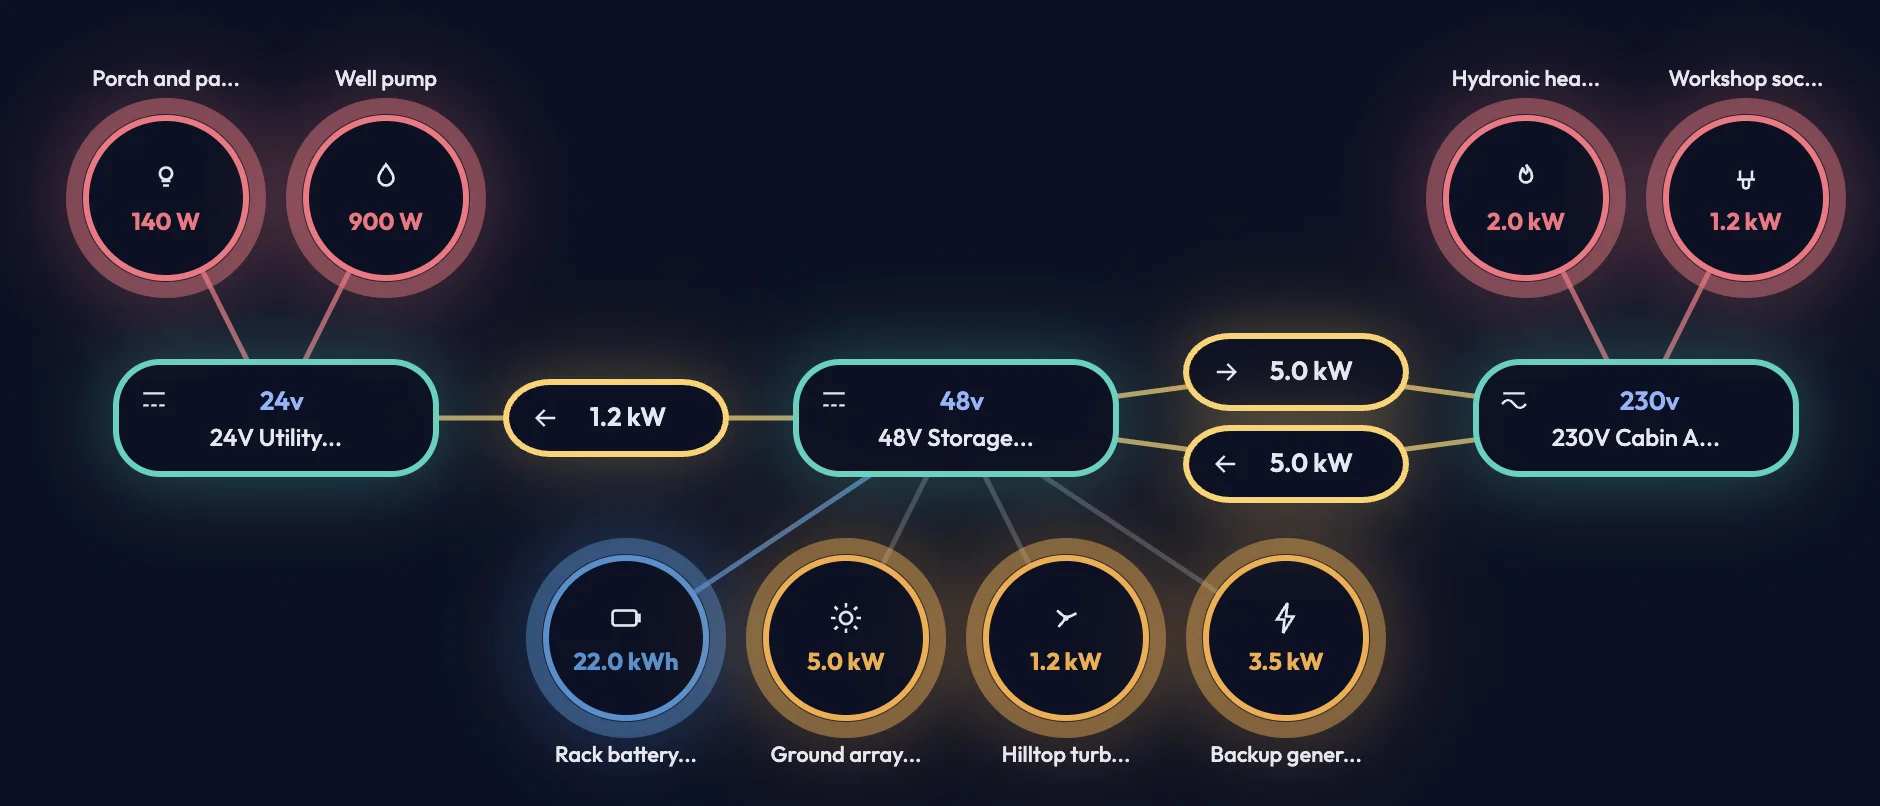
Example: Compare autumn and winter demand profiles to determine when generator support should begin.
Marine systems
Marine setups regularly switch between shore power, alternator charging, and battery usage. PyMox helps you model harbor and sailing states with mixed AC/DC loads. You can validate assumptions before relying on them offshore or at anchor.
Typical challenges
- Unexpected battery drain while anchored
- Load miscalculations across AC and DC circuits
- Charging assumptions that fail in real travel patterns
How PyMox helps
- Visualizes source switching and flow handover
- Models dock versus sailing operating states
- Tracks recurring consumption patterns
Outcomes
- Prevent depletion at anchor
- Understand load distribution
- Plan charging cycles with less guesswork
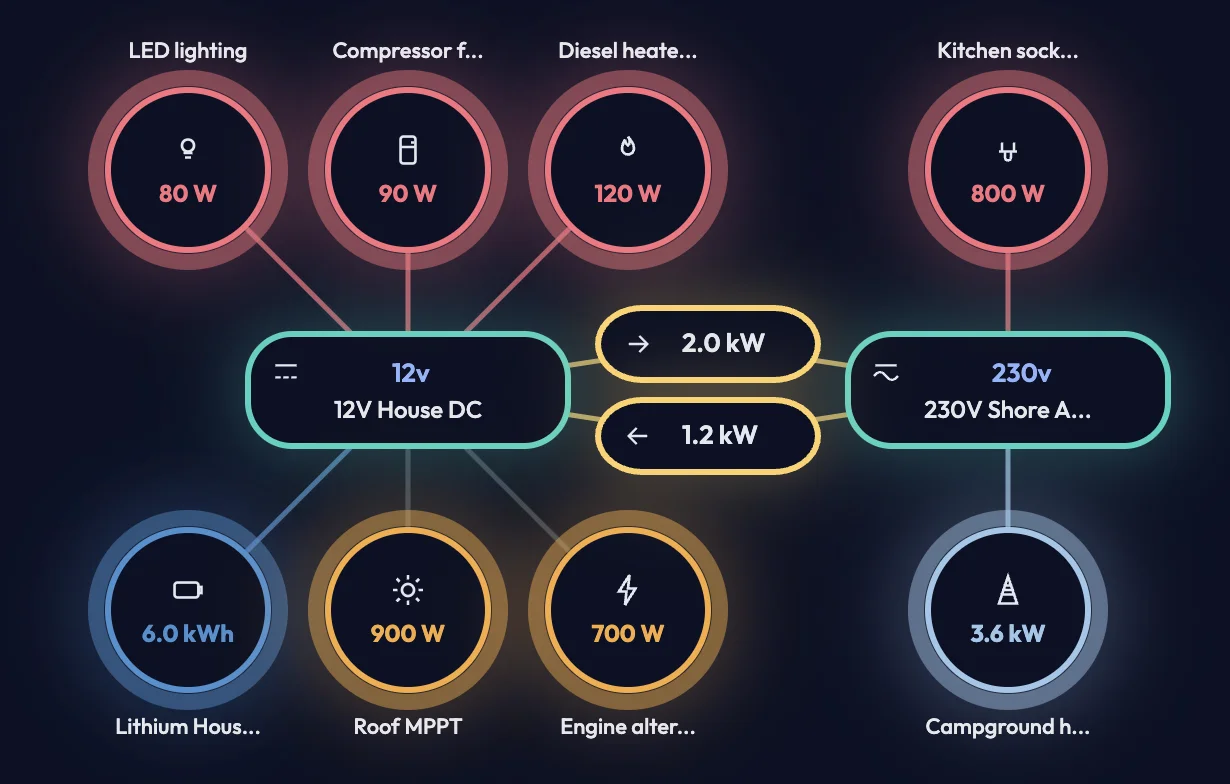
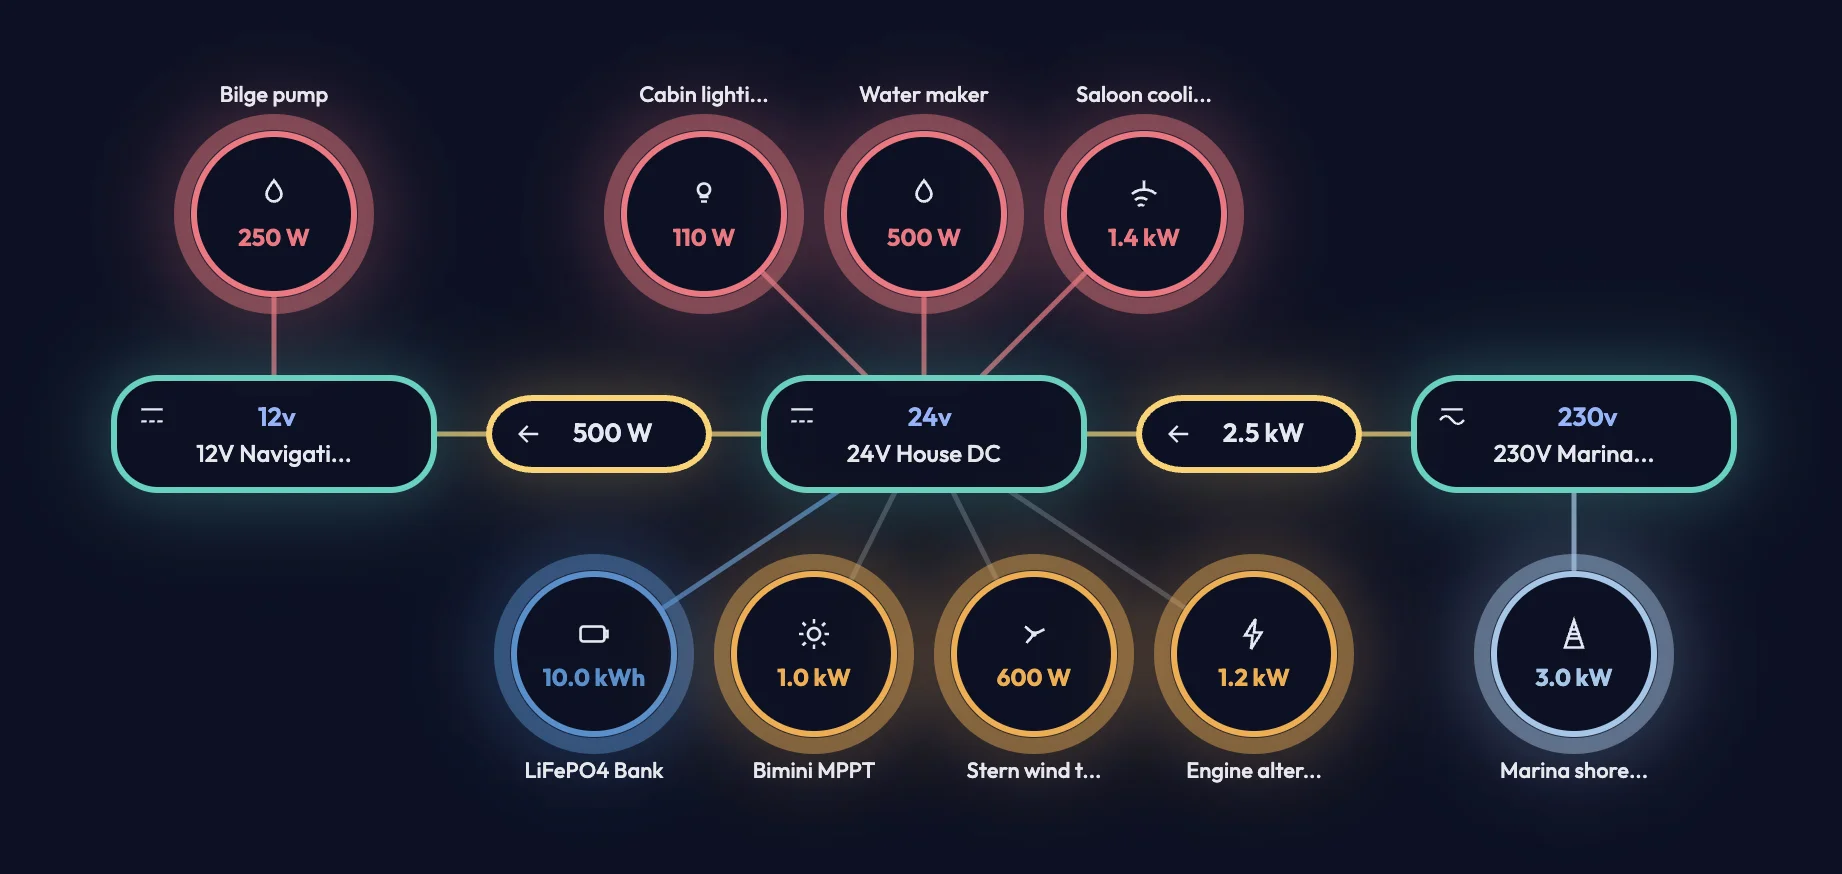
Example: Validate how long anchor loads remain sustainable before alternator or shore charging is required.
DIY powerwall and energy enthusiasts
DIY builders often test many strategy variants before settling on one. PyMox makes those comparisons visible and repeatable in one environment. It provides a clearer logic layer than spreadsheets or isolated vendor views.
Typical challenges
- Spreadsheets that become difficult to maintain
- Vendor dashboards that hide priority logic
- Hard-to-compare strategy modes across scenarios
How PyMox helps
- Provides visual priority modeling
- Represents flow and constraints clearly
- Supports side-by-side strategy comparison
Outcomes
- Compare peak shaving versus island modeling
- Refine discharge thresholds
- Understand grid import spikes
Example: Compare two evening strategies to see whether one reduces peak import while preserving reserve.
Installers and system designers
Installers need to explain system behavior clearly before and after deployment. PyMox supports proposal discussions with modeled scenarios and transparent priority logic. It improves communication without claiming hardware control.
Typical challenges
- Explaining strategy logic clearly to clients
- Showing non-technical users how systems behave
- Managing expectation versus observed behavior
How PyMox helps
- Acts as a visual demonstration tool
- Presents modeled scenarios in a structured way
- Shows priority behavior clearly across modes
Outcomes
- Improve client understanding
- Increase proposal clarity
- Reduce post-install confusion
Example: Walk a client through grid-assisted and battery-priority modes before finalizing system settings.
Home battery owners optimizing ROI
Home battery owners want to understand whether strategy choices are improving outcomes over time. PyMox helps visualize import versus discharge behavior and how energy shifts between peak and off-peak periods. It supports decision-making with technical clarity, not financial guarantees.
Typical challenges
- Unclear savings and uncertain return visibility
- Confusing inverter dashboards for long-term interpretation
- No clear way to evaluate strategy impact over time
How PyMox helps
- Visualizes import versus discharge behavior clearly
- Tracks grid draw reduction trends over time
- Shows energy shifted from peak to off-peak periods
- Models strategy impact on household usage profiles
Outcomes
- See when battery behavior reduces grid cost
- Understand charge timing effects
- Estimate financial impact directionally
- Improve ROI clarity for future decisions
Example: Compare weekday peak-shaving behavior against weekend charge timing to validate whether strategy changes are worth keeping.
PyMox is a decision-support tool and does not provide financial guarantees.